A peptide labeled “98% pure” or “99% pure” may appear easy to evaluate. However, peptide purity percentage explained correctly requires understanding what the percentage actually measures, how laboratories calculate it, and what information it does not provide.
In peptide research, laboratories commonly use HPLC or UPLC to evaluate chromatographic purity. The reported percentage usually reflects the relative area of the principal chromatographic peak compared with other included peaks. Therefore, a high percentage does not automatically confirm molecular identity, exact peptide content by weight, or the absence of every possible impurity.
Having peptide purity percentage explained clearly helps researchers evaluate COAs and laboratory reports without relying on a single headline number.
For additional research-focused peptide information and analytical resources, explore RR Peptides.
What Does Peptide Purity Percentage Mean?
With peptide purity percentage explained through HPLC analysis, the percentage describes how much of the detected chromatographic signal is associated with the principal component.
For example, an HPLC report might state: HPLC Purity: 98.6%
This does not necessarily mean that 98.6% of the entire sample by weight consists of the target peptide.
In many HPLC analyses, laboratories calculate purity from integrated chromatographic peak areas. Therefore, the reported value primarily represents the relative detector response associated with the main peak.
This distinction is central to having peptide purity percentage explained accurately.
Explore quality research peptides in Canada at RR Peptides
Purity, Identity, and Content Are Different
To have peptide purity percentage explained accurately, researchers should distinguish three related analytical concepts:
Measurement
What It Evaluates
Common Approach
Purity
Relative amount of the main chromatographic component
HPLC / UPLC
Identity
Whether the compound is consistent with the expected peptide
Mass spectrometry / MS/MS
Content / Assay
Quantity of target peptide present
Quantitative analytical assay
With peptide purity percentage explained accurately, these measurements can complement each other but should not be treated as interchangeable.
For example, a lyophilized sample may contain the target peptide together with water, counterions, salts, or other materials. Some of these components may not contribute proportionally to the reported HPLC area percentage.
Therefore, chromatographic purity should not automatically be interpreted as total peptide content.
How Peptide Purity Percentage Is Calculated
When peptide purity percentage explained through HPLC reporting is based on peak-area normalization, laboratories compare the main peak with the total relevant integrated peak area.
A simplified formula is: Main Peak Area ÷ Total Relevant Integrated Peak Area × 100 = Area Purity
Consider this hypothetical chromatogram:
Component
Relative Peak Area
Main peptide-related peak
98.4%
Minor peak A
0.7%
Minor peak B
0.5%
Minor peak C
0.4%
Total
100.0%
In this example, the reported chromatographic purity would be approximately 98.4%.
For peptide purity percentage explained accurately, researchers must consider which peaks the analytical method detects and includes in the calculation.
Why the Analytical Method Matters
With peptide purity percentage explained in analytical context, different HPLC conditions can influence the final reported result.
Important parameters include:
column chemistry;
mobile-phase composition;
gradient conditions;
flow rate;
column temperature;
detector wavelength;
sample concentration; and
peak integration settings.
A suitable method should separate the principal component from relevant detectable impurities sufficiently to support meaningful measurement.
Consequently, two laboratories analyzing similar samples may report slightly different percentages if their analytical methods differ.
This does not necessarily mean that one result is incorrect. Instead, researchers need to consider the analytical conditions behind each result.
Understanding HPLC Peak Area Percentage
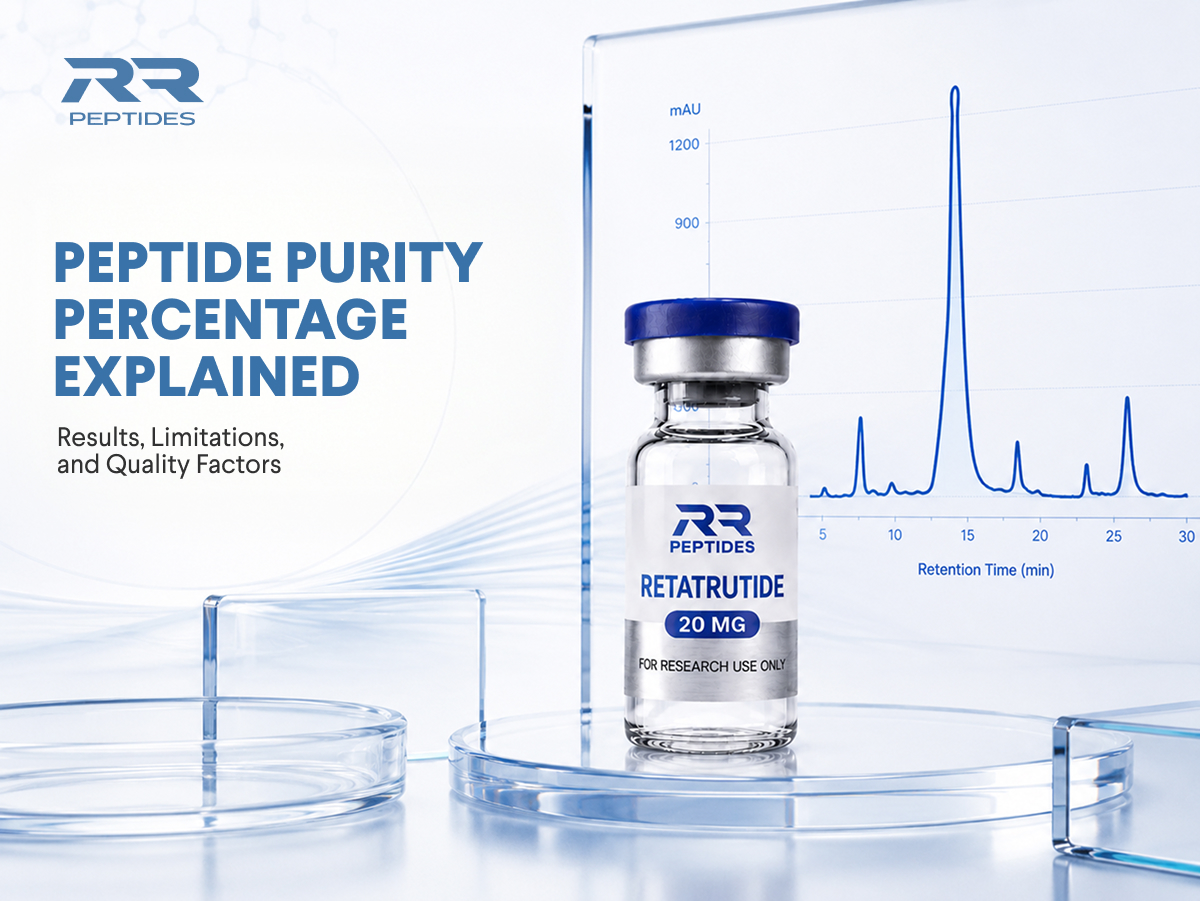
One of the most important parts of peptide purity percentage explained is understanding what an HPLC chromatogram shows.
During reversed-phase HPLC, components in a sample interact differently with the stationary and mobile phases. These differences cause components to move through the column at different rates.
The detector records the separated components as peaks.
The Main Peak
The dominant relevant peak is commonly associated with the target peptide.
When peptide purity percentage explained through peak-area analysis reaches 99%, the main peak represents approximately 99% of the relevant integrated detector response.
However, the size of the peak alone does not establish molecular identity.
A dominant peak could theoretically represent a component other than the expected peptide. For this reason, laboratories may use complementary analytical methods to provide identity information.
Minor Peaks
Smaller chromatographic peaks may represent detectable:
peptide-related impurities;
synthesis-related species;
degradation products;
modified sequences; or
other sample components.
Synthetic peptide production involves multiple chemical steps. Incomplete reactions, sequence-related variants, side reactions, purification limitations, or degradation can potentially contribute to the impurity profile.
When peptide purity percentage explained results are reviewed, the significance of each minor peak depends on the peptide and analytical method.
What Does “99% HPLC Purity” Actually Mean?
A more technically accurate interpretation is:
Under the conditions of this HPLC analysis, the principal integrated component represented approximately 99% of the relevant detected chromatographic area.
That statement differs significantly from saying: The entire sample contains exactly 99% target peptide by weight.
The second claim requires additional quantitative information that HPLC area normalization alone may not provide.
Why HPLC Purity Is Not the Same as Peptide Content
With peptide purity percentage explained correctly, chromatographic purity must be distinguished from peptide content when evaluating COAs.
Consider a hypothetical lyophilized sample containing peptide, water, and counterions.
The HPLC detector may respond strongly to peptide-related components while water and some other substances are not represented proportionally in the chromatographic area calculation.
Therefore, a sample may show: 99% HPLC purity without necessarily containing: 99% peptide by total sample mass
The HPLC result is not necessarily incorrect. It simply answers a different analytical question.
Area Percentage vs Quantitative Assay
Area normalization compares the relative signals of chromatographic peaks.
A quantitative assay aims to determine the actual amount or concentration of the target analyte. Depending on the method, this may require calibration against an appropriate reference standard.
For this reason, researchers should not use purity, assay, and peptide content interchangeably unless the laboratory report clearly defines and supports those measurements.
Does a High Purity Percentage Confirm Peptide Identity?
No. With peptide purity percentage explained correctly, a high chromatographic result does not independently establish molecular identity.
Suppose an HPLC chromatogram contains one dominant peak representing 99.2% of the integrated area. This indicates that one detectable component dominates under the conditions of the analysis.
Researchers still need evidence that the dominant component is consistent with the expected peptide.
Mass Spectrometry Provides Complementary Information
Mass spectrometry (MS) can provide molecular information that complements HPLC analysis.
The technique analyzes ions according to their mass-to-charge ratio (m/z). Researchers can compare observed molecular-mass information with the theoretical mass expected from the peptide.
When the observed values agree appropriately with theoretical expectations, the results can support molecular identity.
In simple terms:
HPLC → evaluates chromatographic composition
Mass spectrometry → supports molecular identity
Using both approaches can provide a more informative analytical picture.
Why Complementary Evidence Matters
No single analytical measurement necessarily answers every quality question.
For example: HPLC purity + MS identity provides evidence about two different characteristics of the sample.
Depending on the analytical objective, researchers may also require additional testing for moisture, residual solvents, peptide content, or other characteristics.
Therefore, a high purity percentage should be considered one part of analytical characterization, not a complete quality profile.
Explore quality research peptides in Canada at RR Peptides
Factors That Can Influence Reported Purity
Several analytical and sample-related factors matter when peptide purity percentage explained results are interpreted from a laboratory report.
1. Chromatographic Separation
If two compounds are not adequately separated, their peaks may overlap.
Poor resolution can make it difficult to determine the individual contribution of each component. Therefore, chromatographic separation is important when evaluating peptide-related impurities.
2. Detection Conditions
Different compounds do not necessarily produce identical detector responses.
Detection wavelength and molecular properties can influence how strongly components appear on the chromatogram.
Therefore, peak-area percentage should be interpreted within the conditions of the method.
3. Peak Integration
Chromatography software calculates peak areas, but integration settings determine where peaks begin and end.
Baseline selection, integration thresholds, and treatment of small peaks may influence the reported percentage.
Consequently, small differences between laboratories may sometimes reflect analytical processing rather than major differences in the samples.
4. Sample Preparation
Sample concentration, solvent selection, dissolution, filtration, and handling can influence analytical performance.
Appropriate preparation is therefore necessary before chromatographic analysis.
5. Storage and Degradation
Peptides may undergo chemical changes under unsuitable conditions.
Depending on the molecule, moisture, temperature, oxidation, or prolonged storage may contribute to degradation. If the analytical method detects these degradation products, additional chromatographic peaks may appear.
The reported purity therefore describes the sample as analyzed at a particular time, rather than representing a permanent characteristic.
Why Purity Results Need Analytical Context
When considering peptide purity percentage explained correctly, researchers should evaluate the number together with the method used to generate it.
Two reports may both show approximately 99% purity but use different columns, gradients, detector wavelengths, sample concentrations, or integration thresholds.
These differences can influence separation and peak calculations.
When all three are available, researchers have considerably more information for interpreting the result.
For example, a report showing 99.1% purity alongside a clearly identified HPLC method and chromatogram may provide more analytical context than a document that simply states “99.8% purity” without supporting data.
This principle also applies when comparing results from different laboratories. A small numerical difference should not automatically be interpreted as evidence that one sample is meaningfully purer than another.
Instead, researchers should consider whether the methods and reporting conditions are comparable.
How to Evaluate a Reported Peptide Purity Percentage
With peptide purity percentage explained properly, researchers should avoid evaluating documentation solely by whether the result is 98%, 99%, or higher.
Instead, examine the supporting analytical information.
Information
Why It Matters
Sample name
Identifies the material analyzed
Batch or lot number
Links results to a specific production lot
Analytical method
Explains how purity was measured
HPLC chromatogram
Shows chromatographic separation
Retention time
Provides information about peak elution
Peak-area data
Shows how the percentage was derived
MS data, if performed
Provides complementary identity evidence
Test date
Indicates when analysis occurred
Look Beyond the Headline Number
A COA that simply states “99% purity” provides limited context.
Researchers should ideally be able to determine:
What analytical method was used?
Which batch was tested?
Is the chromatogram available?
Was molecular identity evaluated separately?
When was the sample tested?
These questions help determine how much analytical information the reported percentage actually provides.
Why Batch-to-Batch Variation Matters
Peptide purity can vary between production batches.
Synthetic peptide manufacturing involves several stages, including sequence assembly, cleavage, purification, drying, and storage. Variations during these processes may influence the final impurity profile.
Therefore, a purity result from one production lot should not automatically be assumed to represent every future batch of the same peptide.
Batch-specific analytical documentation helps connect the reported percentage with the material actually being evaluated.
Ideally, the batch or lot number shown on the laboratory report should correspond with the relevant sample.
Comparing Multiple Batches
Repeated analytical testing can provide a broader picture of manufacturing consistency.
Researchers may compare:
chromatographic purity;
overall chromatogram profiles;
major and minor peaks;
molecular identity results;
batch numbers; and
testing dates.
Small numerical differences between batches do not automatically indicate a quality problem. Analytical variation, sample preparation, storage conditions, and minor manufacturing differences may all influence results.
The testing date can also provide important context.
A COA from an older batch may not necessarily characterize recently produced material. Manufacturing sources, purification processes, storage conditions, or analytical laboratories may change over time.
Therefore, recent batch-specific documentation generally provides more relevant information about the material currently being evaluated than a historical report without a clear connection to the present batch.
Comparing Purity Results Between Laboratories
When reviewing peptide purity percentage explained across laboratories, researchers may encounter different results for similar samples.
For example: Laboratory A: 99.3%, Laboratory B: 98.9%
The immediate assumption may be that Laboratory A analyzed a purer sample. However, this conclusion may be premature.
Differences can arise from:
HPLC column selection;
gradient design;
detector settings;
integration thresholds;
sample preparation;
instrument performance; or
sample condition at the time of analysis.
If the laboratories used different methods, direct numerical comparison may have limited meaning.
Therefore, when comparing reports, researchers should evaluate not only the final percentage but also whether the analytical conditions are sufficiently similar to support comparison.
This is another reason why detailed laboratory documentation can be more useful than an isolated purity claim.
Is a Higher Purity Percentage Always Better?
With peptide purity percentage explained in context, a higher percentage generally means other detected peaks contribute less to the relevant chromatographic response.
However, the highest number is not automatically the most informative result.
For example, a reported 99.7% purity without a chromatogram, batch identifier, or analytical method may provide less useful information than a 99.1% result supported by detailed analytical documentation.
Likewise, small differences such as 99.0% versus 99.3% should not automatically be treated as scientifically significant without understanding the methods used.
Instead of asking only: “Which peptide has the highest purity percentage?”
researchers should ask: “How was the percentage generated, and what evidence supports it?”
This approach provides a more meaningful interpretation of peptide analytical data.
A peptide purity percentage commonly describes the relative chromatographic detector response associated with the principal component compared with other included peaks under specific analytical conditions.
How is peptide purity percentage calculated?
For HPLC area normalization, the main integrated peak area is commonly divided by the total relevant integrated peak area and multiplied by 100.
Is 99% HPLC purity equal to 99% peptide by weight?
Not necessarily. HPLC area purity and total peptide content by mass are different measurements.
Does high peptide purity confirm identity?
No. A high chromatographic purity result does not independently prove molecular identity. Mass spectrometry can provide complementary identity information.
What can minor HPLC peaks represent?
Minor peaks may represent detectable peptide-related impurities, degradation products, synthesis-related species, or other components.
Can two laboratories report different purity percentages?
Yes. Differences in analytical methods, instrumentation, sample preparation, integration settings, and sample condition can affect reported results.
Why is the chromatogram important?
The chromatogram shows the analytical separation behind the reported percentage, allowing researchers to examine the principal and minor detectable peaks.
Why does the batch number matter?
A batch number connects the laboratory result with a specific production lot. Results from one batch should not automatically be assumed to characterize another.
Can peptide purity change over time?
Potentially. Depending on the peptide and storage conditions, degradation may alter the impurity profile. Therefore, testing date and sample condition can be relevant when interpreting results.
Is the highest purity percentage always the best result?
Not necessarily. Researchers should consider method suitability, chromatographic evidence, batch traceability, identity data, and overall documentation alongside the final percentage.
Final Thoughts
Having peptide purity percentage explained accurately means looking beyond a single number on a COA.
HPLC purity generally describes the relative chromatographic response of the principal component under defined analytical conditions. It does not automatically establish total peptide content, molecular identity, or the absence of every possible impurity.
Researchers should therefore consider the analytical method, chromatogram, peak integration, sample preparation, batch information, testing date, and complementary identity evidence when reviewing a purity result.
Batch-specific and recent analytical documentation can provide additional context, while comparisons between laboratories should account for differences in analytical methods rather than focusing only on small numerical differences.
Ultimately, a reported value of 98%, 99%, or higher becomes much more meaningful when researchers understand what was measured, how the result was calculated, which sample was analyzed, and what the percentage can—and cannot—demonstrate.
For additional research-focused peptide information and analytical resources, explore RR Peptides.
Disclaimer: All products and compounds referenced are intended strictly for laboratory and research purposes only. This content is provided for informational and educational purposes and is not intended as medical advice or to diagnose, treat, cure, or prevent any disease.
3 Comments
Really helpful explanation of what peptide purity percentages actually mean. I liked that the article goes beyond simply comparing numbers and explains why the testing method and analytical context also matter. A practical example showing how to interpret a reported purity percentage would be useful.
I found this article particularly useful because purity percentages can be easy to misunderstand without knowing how they were measured. The discussion of analytical verification adds important context when comparing research materials. I’d be interested in seeing more about how HPLC results contribute to a reported purity value.
Appreciate the straightforward approach to explaining peptide purity. It’s a good reminder that a high percentage on its own doesn’t necessarily tell the whole story about a research sample’s quality or identity. A follow-up comparing purity, identity and other quality-control measures would be very informative.





Really helpful explanation of what peptide purity percentages actually mean. I liked that the article goes beyond simply comparing numbers and explains why the testing method and analytical context also matter. A practical example showing how to interpret a reported purity percentage would be useful.
I found this article particularly useful because purity percentages can be easy to misunderstand without knowing how they were measured. The discussion of analytical verification adds important context when comparing research materials. I’d be interested in seeing more about how HPLC results contribute to a reported purity value.
Appreciate the straightforward approach to explaining peptide purity. It’s a good reminder that a high percentage on its own doesn’t necessarily tell the whole story about a research sample’s quality or identity. A follow-up comparing purity, identity and other quality-control measures would be very informative.